The Sustainability Strategy Map (part 2 of 2)
More detail about the Sustainability Strategy Map
This is the second part of the conversation around a Sustainability Strategy Map. Part 1 can be found here.
The following video covers Part 1 and 2. If you viewed Part 1, just skip forward to minute 6 in this video:
The starting point

Part 1 of this series presented this Sustainability Strategy Map as a template to test with real organizations.
An example completed Sustainability Strategy Map

In the above case, we took the strategy for a small manufacturing firm and combined it with their sustainability strategy and drew it on the Sustainability Strategy Map template. (It seems a bit generic because we removed all company-specific content for this article.)
The Triple Top-Line

At the top of the map, you can see their "Triple TOP lines" - what are they looking to achieve within the perspectives of Society, the Environment... AND their business strategic Financial goals.
The Balanced Scorecard strategy map (the center column of the Sustainability Strategy Map) has the Financial success of private-sector organizations as the ultimate outcome. That makes sense, because if a business does not achieve their financial targets, they will cease to exist, and not be able to offer benefits to society, the environment, employees or their customers. (We will offer a Government, NGO and NFP template later).
Within the Sustainability Strategy Map we feel it is critical that ALL THREE "bottom lines" are shown, so that none are sacrificed in aid of the other. (it reminds me of that old quality expression: "Cost, Quality or Time - pick any two!")
The Cause-and-Effect Hypothesis
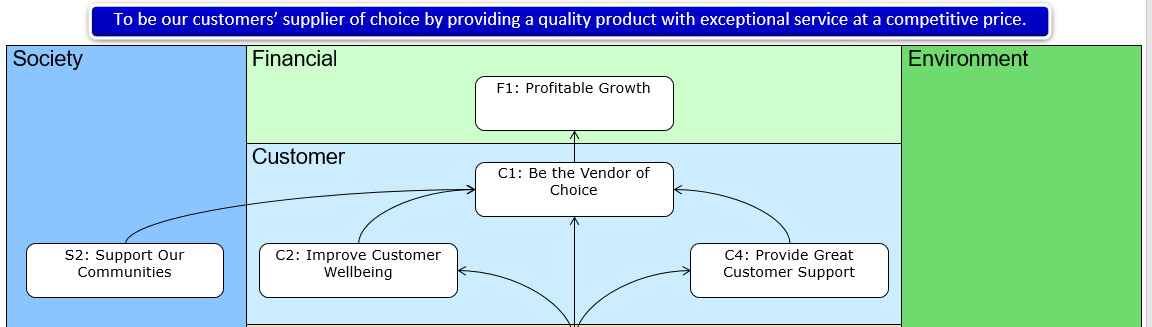
The most important part of the strategy map, some argue, are the arrows that explain WHY we do things. In this case, we can only achieve Profitable Growth (F1) if we become "The Vendor of Choice" (C1). Now, obviously there are many other things we need to do to achieve "Profitable Growth" ...but the most important of which, leadership has hypothesized, is Vendor of Choice (not cost reduction, etc.).
Continuing to read the arrows, to become Vendor of Choice there are four things we must do. C2 "Improve Customer Wellbeing" reflects a higher calling for this business than just "meet and exceed customer needs". In this case they were thinking of the concepts within the Future-Fit Business Benchmark.
They also must "Support Our Communities" (S2). in this case they were thinking of three communities they directly impact - those of their suppliers, their own operations, and their customers. If they do not support those communities, they cannot become Vendor of Choice.

Another example of their cause-and-effect hypothesis, informed by Future-Fit, is the need to ensure the inputs their operations use do not harm (E2), and the outputs of their operations do no harm (E3).
Prioritizing the Strategic Goals
We are going to leave this topic for another article... but the executive summary is: Not all these goals are equally important. The essence of strategy is about prioritizing what we do, when.
For now we will ignore the weighting.
Adding Performance Indicators

In Part 1 we showed the connection between the Future-Fit Business Benchmark measures and the Sustainability Strategy Map perspectives.
So, if we link the Future-Fit measures with this company's Strategic Goals, we get this mapping:
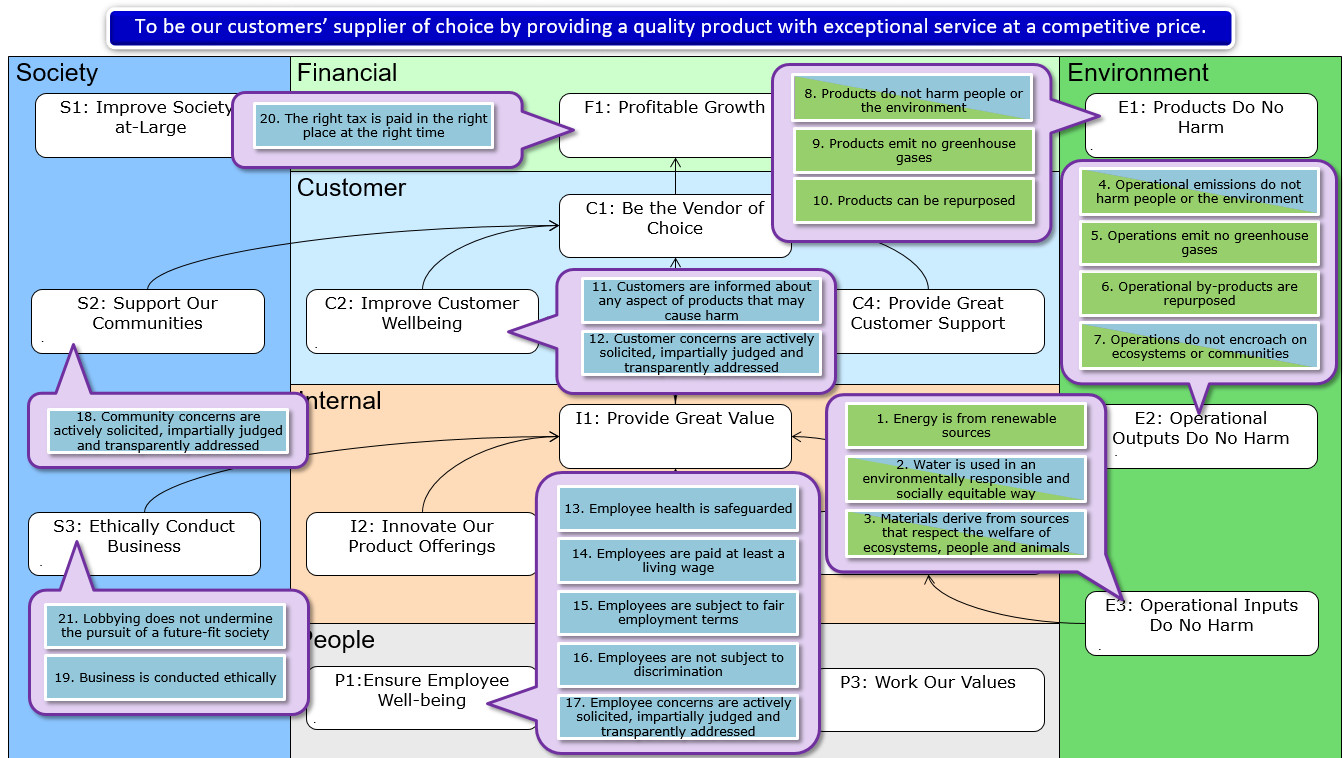
If we combine these two views - the Sustainability Strategy Map and the Future-Fit Business Benchmark measures, we can see how we can populate each of these goals with hard measures.
Future-Fit is not the only resource for measurement ideas - most of the other Sustainability frameworks have long lists of recommended measures (for example, UN-Sustainable Development Goals, GRI, B-Corp). We have the luxury of picking the best-of-breed measures across all this great work, research and experience!
We often find organizations are "held ransom" by the data. They cannot find the perfect indicator, and so they stop and wait until they build the new data-collection process, gather data, develop an history, etc. (In other words, the project fails). In a later LinkedIn article, we will explain how the use of indicators frees you from that hostage-taking problem. (e.g. use employee absenteeism as an indicator of employee satisfaction).
The Sustainability Scorecard
Adding indicators to the Sustainability Strategy Map give us The Sustainability Scorecard

The colored icons are based on actual performance compared to the "comparator" ...e.g. Target, Last-Year, Best-In-Class, etc. The small icon next to that tells us if we are trending up , stable or trending down.
This now becomes the ONE tool every team, department, project team, department and corporate team uses to view performance...and it includes all issues (sustainability, performance, risk, human capital, projects, etc.)

Obviously one can then drill down / across / up to "go wherever the enquiringly mind" wants to go.

Latest Posts

The post explains how OKRs help organizations adapt to changing business environments and align strategy, budget, and performance.